In a nutshell
A high-performance tool that merges two graphs, a line and a bar.
What else?
But at first people tend to say “I don’t get it,” and now and then you forget how to use it. Avocado salmon sushi.
Just drawing it won’t reduce a single problem. But it shows at a glance which one is the strongest.
What Is a Pareto Chart?
A Pareto chart lines up problems as bars, most frequent first. On top of that, a line shows the share added up from the top (cumulative).
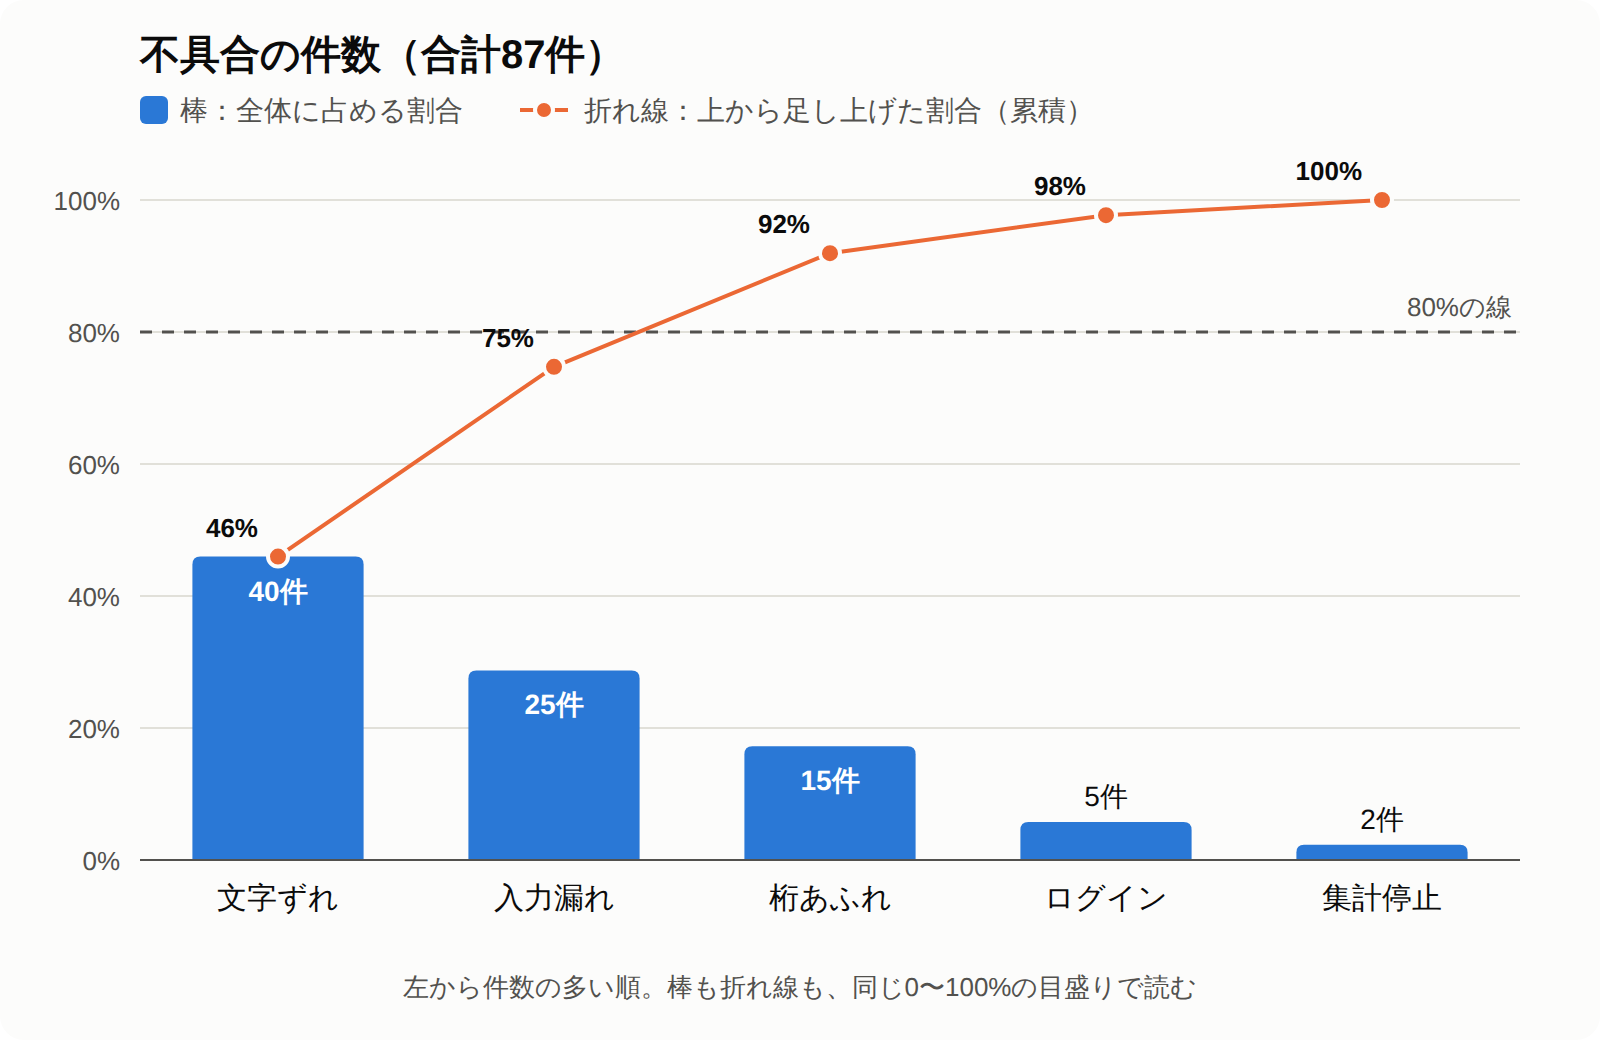
In this example, the top two make up 75% of the total. Even if you clear all of the bottom three, only the remaining 25% goes away.
“Okay, let’s start with the misaligned text and the missing entries,” and so on: where to start is decided at a glance.
The Pareto principle (the 80/20 rule)
The top 20% of items account for 80% of the total. This rule of thumb is called the Pareto principle (the 80/20 rule).
It doesn’t always come out to exactly 20% and 80%. It’s a guide that says there is a skew, roughly toward 80%.
On a Pareto chart, the items up to where the line reaches about 80% are the candidates to tackle first.
Choose what to measure by
But if you choose the wrong yardstick to line things up by, the chart itself lies.
I failed at exactly this.
Instead of crushing the defects with the biggest impact first, I fixed them one by one from the top of the list. The count certainly went down. Even so, the high-impact defects stayed to the very end.
Line up the same defects not by count but by “time work was stopped,” and you get this.
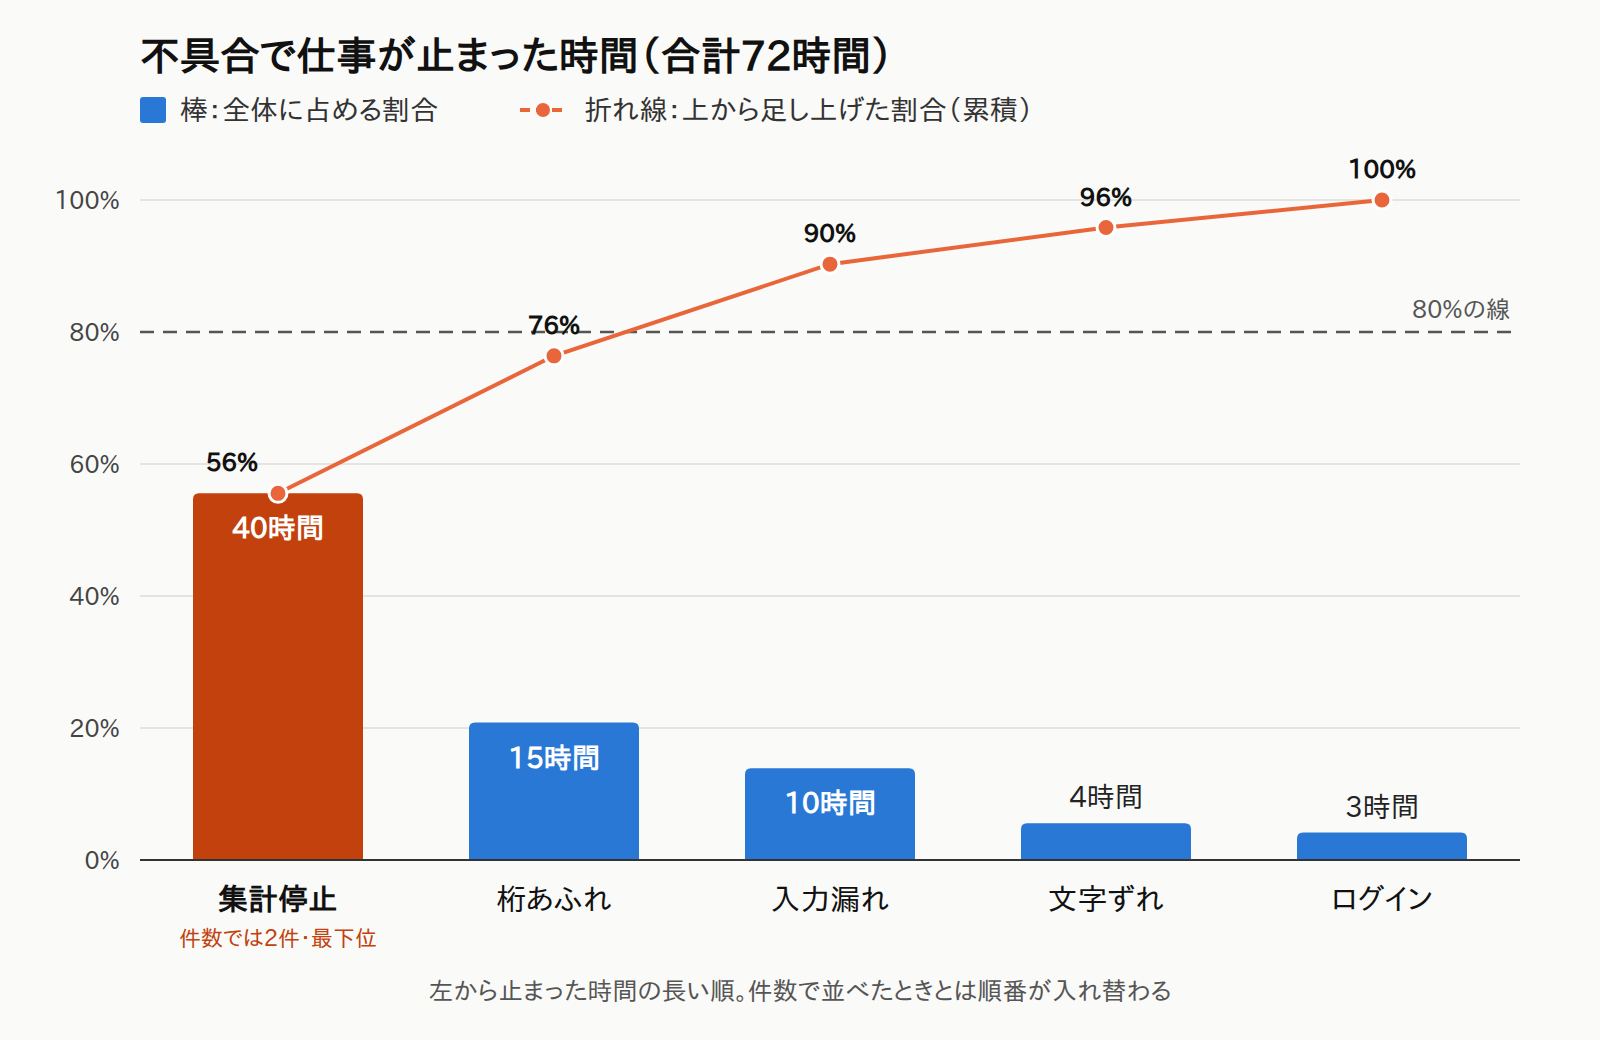
“Tally stalls,” last by count, rises to first. There are only two cases, but when it hits, the whole month-end job stops.
What I should have picked first in this case was the tally stalls. Fixing just those two cases removes more than half (56%) of the stopped time. Fix the digit overflow next and it reaches 76%. Misaligned text, first by count, saves only four hours even if every case is fixed.
What to count is decided by people.
- Count: The number of times it happened. Easy to count, but light issues tend to rise to the top.
- Impact: Time stopped, rework effort, money. Harder to count, but the things that really hurt rise to the top.
The most important job with a Pareto chart is not drawing the chart, but choosing the yardstick to line things up by.
It works for ABC analysis too
The same way of lining things up is used for managing inventory and products. This is called ABC analysis.
Line up products from the largest sales down, and split them into A, B, and C by cumulative share.
- A: The few products that make up most of the sales. Manage them closely so they never run out.
- B: In between.
- C: Many products, but small sales. Don’t spend too much effort managing them.
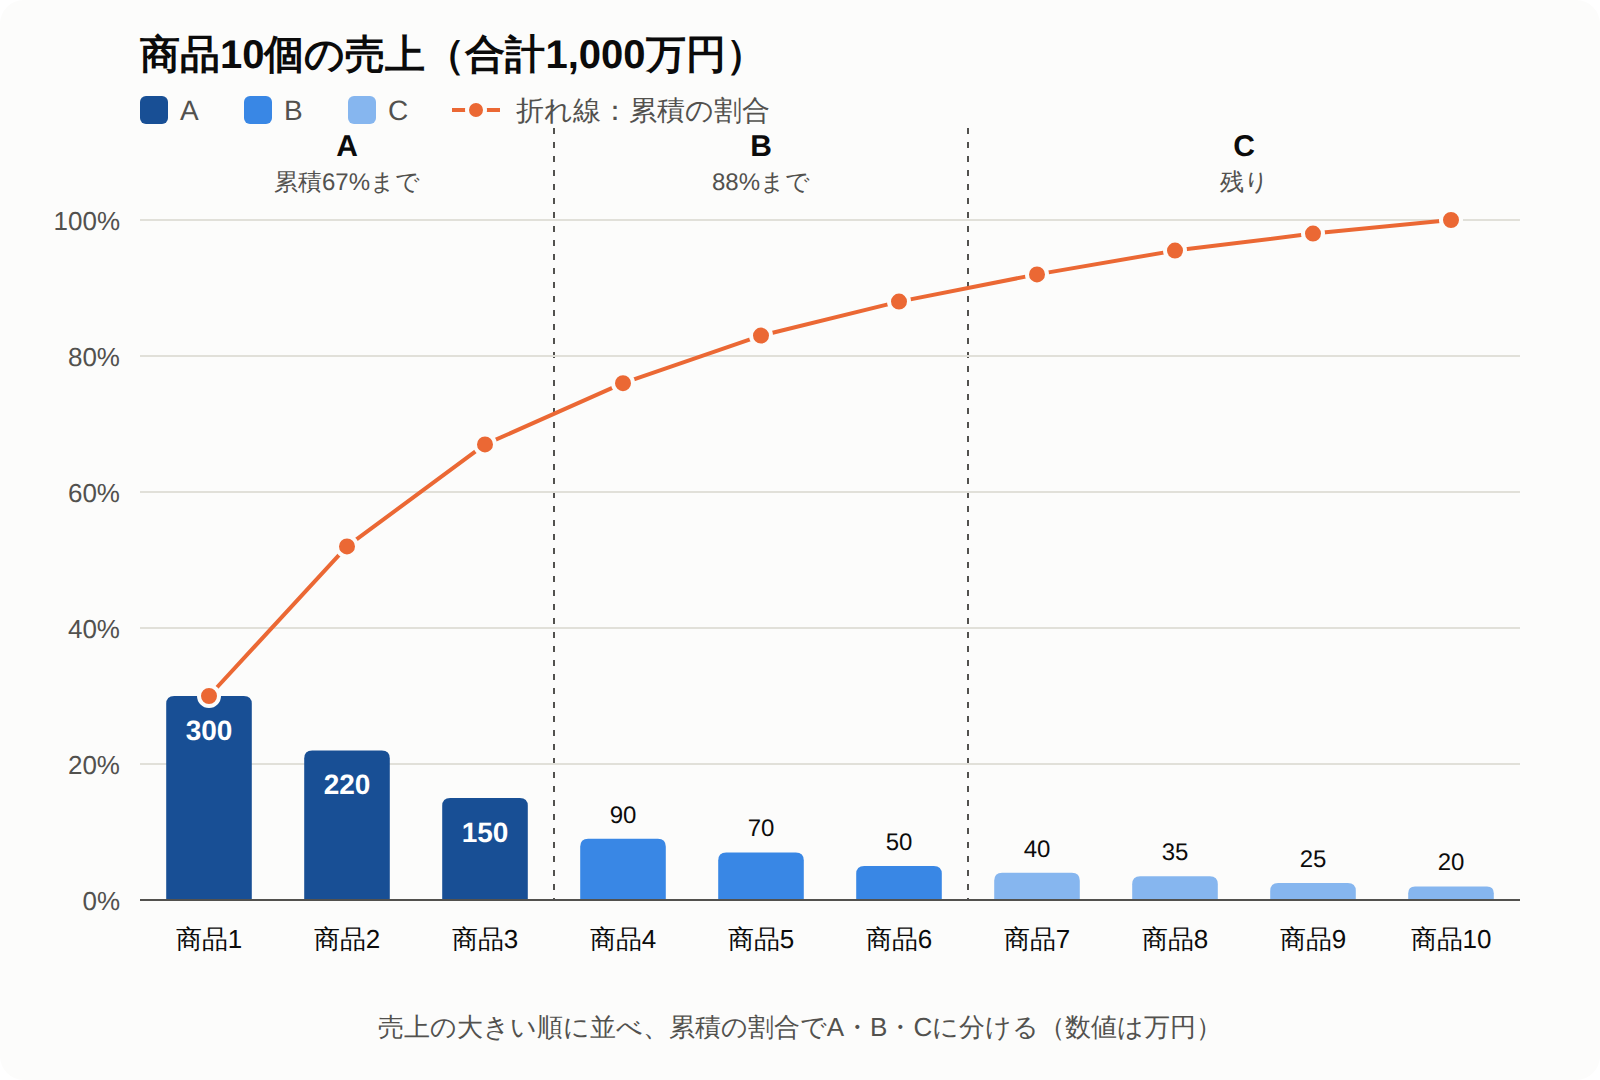
In this example, the top 3 of 10 products make up 67% of sales. These 3 become A.
Where to draw the lines is decided by each company or product.
Its role among the seven QC tools
The Pareto chart is one of the “seven QC tools” used in QC activities.
You count with a check sheet, pick the biggest problem with a Pareto chart, and dig into why it happens with a cause-and-effect diagram. They connect in that order.
The steps for actually finding and narrowing down problems at work are introduced in How to Start Improving Your Work, Part 1 (ma-dailywork, in Japanese).
Takeaways
Most of the time, you end up making the chart from numbers you can see (pieces / cases / amounts and so on).
Super handy.
But for some reason, I sometimes forget it exists.
I easily forget how to use it, too.
Wait, why was this line here again??
Trivia
- Vilfredo Pareto: An Italian economist (1848–1923). He taught at the University of Lausanne in Switzerland.
- Joseph M. Juran: An American quality control expert. Editor of the Quality Control Handbook.
- The vital few and the useful many: Juran’s phrase. He first called it “the vital few and the trivial many,” and later changed it to “the useful many.”
History
The start
It began not with quality but with money. In 1897, Pareto studied income statistics from several countries and expressed in a formula how heavily income was concentrated in a few people (Pareto, Cours d’économie politique, vol. 2, 1897 (archive.org)).
In 1905, the American statistician Lorenz published a way to draw the concentration of wealth as an added-up curve. This is the ancestor of the Pareto chart’s line (Lorenz, Methods of Measuring the Concentration of Wealth, 1905 (JSTOR)).
The naming slip
The one who brought it into the world of quality was Juran, an American quality control expert. In the 1920s, as a young engineer, Juran had noticed that when defects were lined up from most to least, a few types made up most of them. In the 1951 Quality Control Handbook, he showed this skew as an added-up curve and attached Pareto’s name to it.
But in 1974, Juran himself wrote that he had “misnamed” it. Pareto had studied only the concentration of wealth; the one who proposed it as a principle that applies to every field was Juran himself. The curve, too, should have been named after Lorenz, he said (Juran, The Non-Pareto Principle; Mea Culpa, 1974 (Juran Institute)).
Even so, the name stuck.
To Japan
In 1954, Juran was invited to Japan and taught quality control to executives and managers (Chronology: Professor Ishikawa, who walked alongside Japan’s TQC (JUSE), in Japanese). The Pareto chart later came to be counted among the seven QC tools in Japanese workplaces.
Today
Today, “Pareto” is built into Excel’s list of chart types. Select the data you counted, and it draws the sorting and the cumulative line automatically (Microsoft Support, “Create a Pareto chart”).
The effort of drawing is nearly gone. What’s left is the job of deciding what to count.
Timeline
| Period | Key events | Key people and organizations | Country or region | Notes |
|---|---|---|---|---|
| 1897 | Pareto expresses the concentration of income in a formula | Vilfredo Pareto | Switzerland (Lausanne) | In the “curve of incomes” chapter of Cours d’économie politique, vol. 2, he turned the way income concentrates in a few into a formula, using income statistics from several countries. It covered only the distribution of money. [Pareto, Cours d’économie politique, vol. 2 (archive.org)](https://archive.org/details/fp-0148-2) |
| 1905 | Lorenz draws the concentration of wealth as an added-up curve | Max O. Lorenz | United States | He turned the share added up from the bottom into a curve, so the size of the skew could be compared at a glance. The ancestor of the Pareto chart’s line. [Lorenz, 1905 (JSTOR)](https://www.jstor.org/stable/2276207) |
| 1920s | Juran notices the skew in defects | Joseph M. Juran | United States | As a young engineer, he saw that when defects were lined up from most to least, a few types made up most of them. [Juran, The Non-Pareto Principle; Mea Culpa (Juran Institute)](https://www.juran.com/wp-content/uploads/2021/03/The-Non-Pareto-Principle-1974.pdf) |
| 1951 | Pareto’s name is attached in the Quality Control Handbook | Joseph M. Juran | United States | He showed the skew of quality losses as an added-up curve and named it “the Pareto principle.” [Juran, 1974 (Juran Institute)](https://www.juran.com/wp-content/uploads/2021/03/The-Non-Pareto-Principle-1974.pdf) |
| 1954 | “The vital few and the trivial many” appears in a paper | Joseph M. Juran | United States | Juran wrote that the phrase first appeared in print in a paper in Management Review. [Juran, 1974 (Juran Institute)](https://www.juran.com/wp-content/uploads/2021/03/The-Non-Pareto-Principle-1974.pdf) |
| 1954 | Juran visits Japan and teaches quality control | Joseph M. Juran | Japan | He came to Japan and held courses for executives and managers. [Chronology: Professor Ishikawa (JUSE), in Japanese](https://www.juse.jp/ishikawa/ningen/Chronology_20150519.pdf) |
| 1974 | Juran admits the “misnaming” | Joseph M. Juran | United States | He wrote that Pareto had studied only the concentration of wealth, that he himself had made it a principle for every field, and that the curve should have been named after Lorenz. [Juran, The Non-Pareto Principle; Mea Culpa](https://www.juran.com/wp-content/uploads/2021/03/The-Non-Pareto-Principle-1974.pdf) |
| Today | Excel includes the Pareto chart as standard | Microsoft | — | Just pick it from the chart types, and it draws the sorting and the cumulative line automatically. [Microsoft Support, “Create a Pareto chart”](https://support.microsoft.com/en-us/excel/create-a-pareto-chart) |