In a nutshell
A cause-and-effect diagram is
a big-hearted tool that takes in every cause and effect, big, medium, and small, with arms wide open.
Judy Ongg (picture the singer spreading her huge white sleeves).
What else?
Whatever it is, if it might be a cause, toss it in.
It’s fine to be sloppy at first. Just tidy up later.
What Is a Cause-and-Effect Diagram?
It is also called the Ishikawa diagram, and from its distinctive shape, the fishbone diagram.
In Japanese it is tokusei yoin zu. Tokusei (characteristic) means the result.
Yoin (factor) means a cause that seems to produce that result.
It is a diagram that organizes the relationship between the result and its factors, hence the name (Satoshi Ebata, “Key Points for Using the Seven QC Tools, Part 5: The Cause-and-Effect Diagram” (JUSE), in Japanese).
The cause-and-effect diagram is one of the “seven QC tools” used in QC activities. You use a Pareto chart to pick the biggest problem, a cause-and-effect diagram to line up candidates for why it happens, and a check sheet to count and confirm. They connect in that order.
How to make one
Write the problem at the head on the right. From the backbone leading to it, grow several big bones, then attach medium bones to the big bones, and small bones after that.
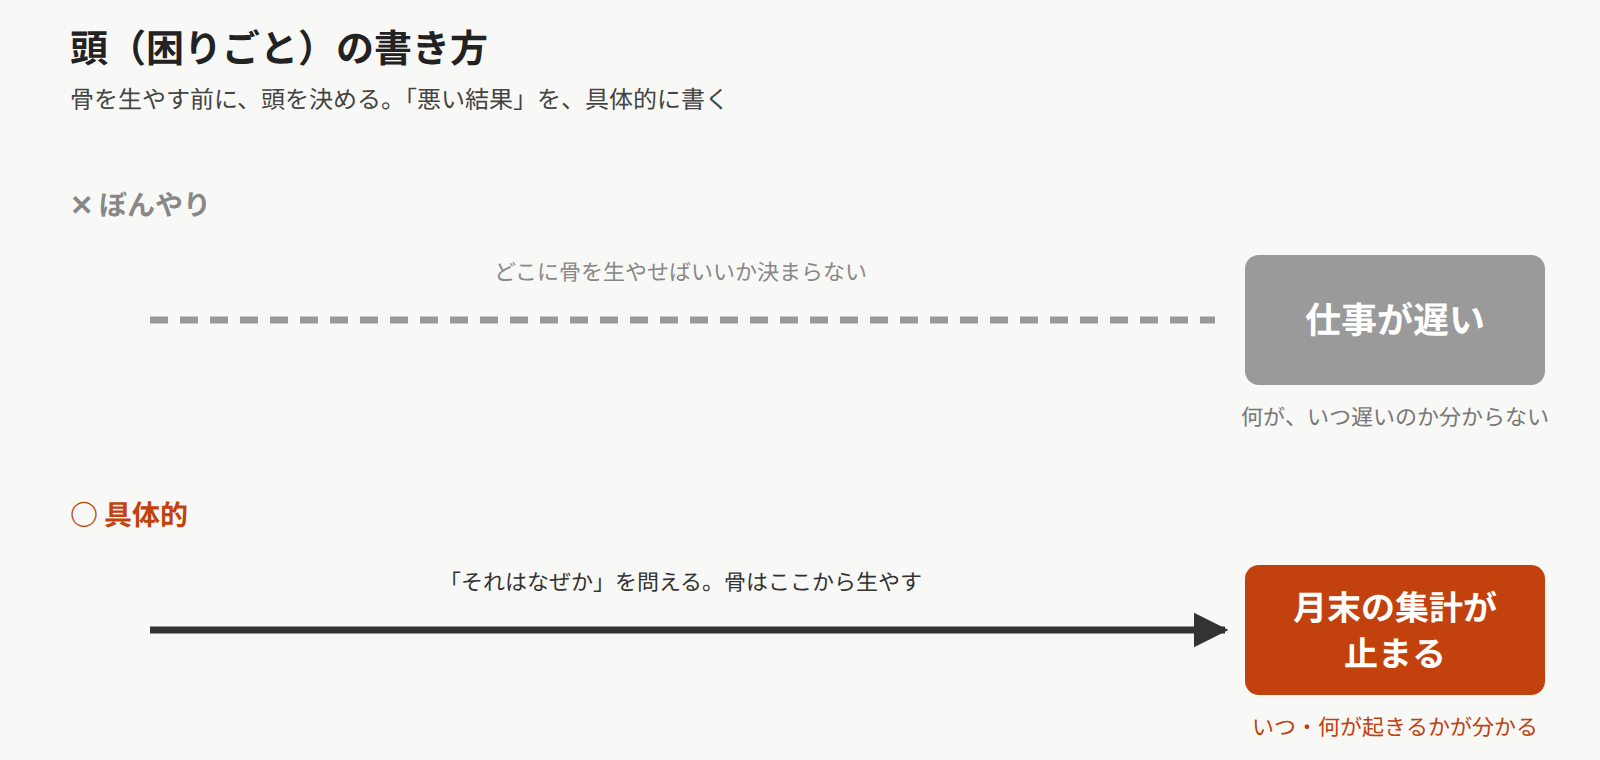
The problem should be a “bad result,” and the more specific, the better.
For example, not “work is slow,” but “the month-end tally stalls.”
It works best when several people are pinning down the biggest cause together. There are four steps.
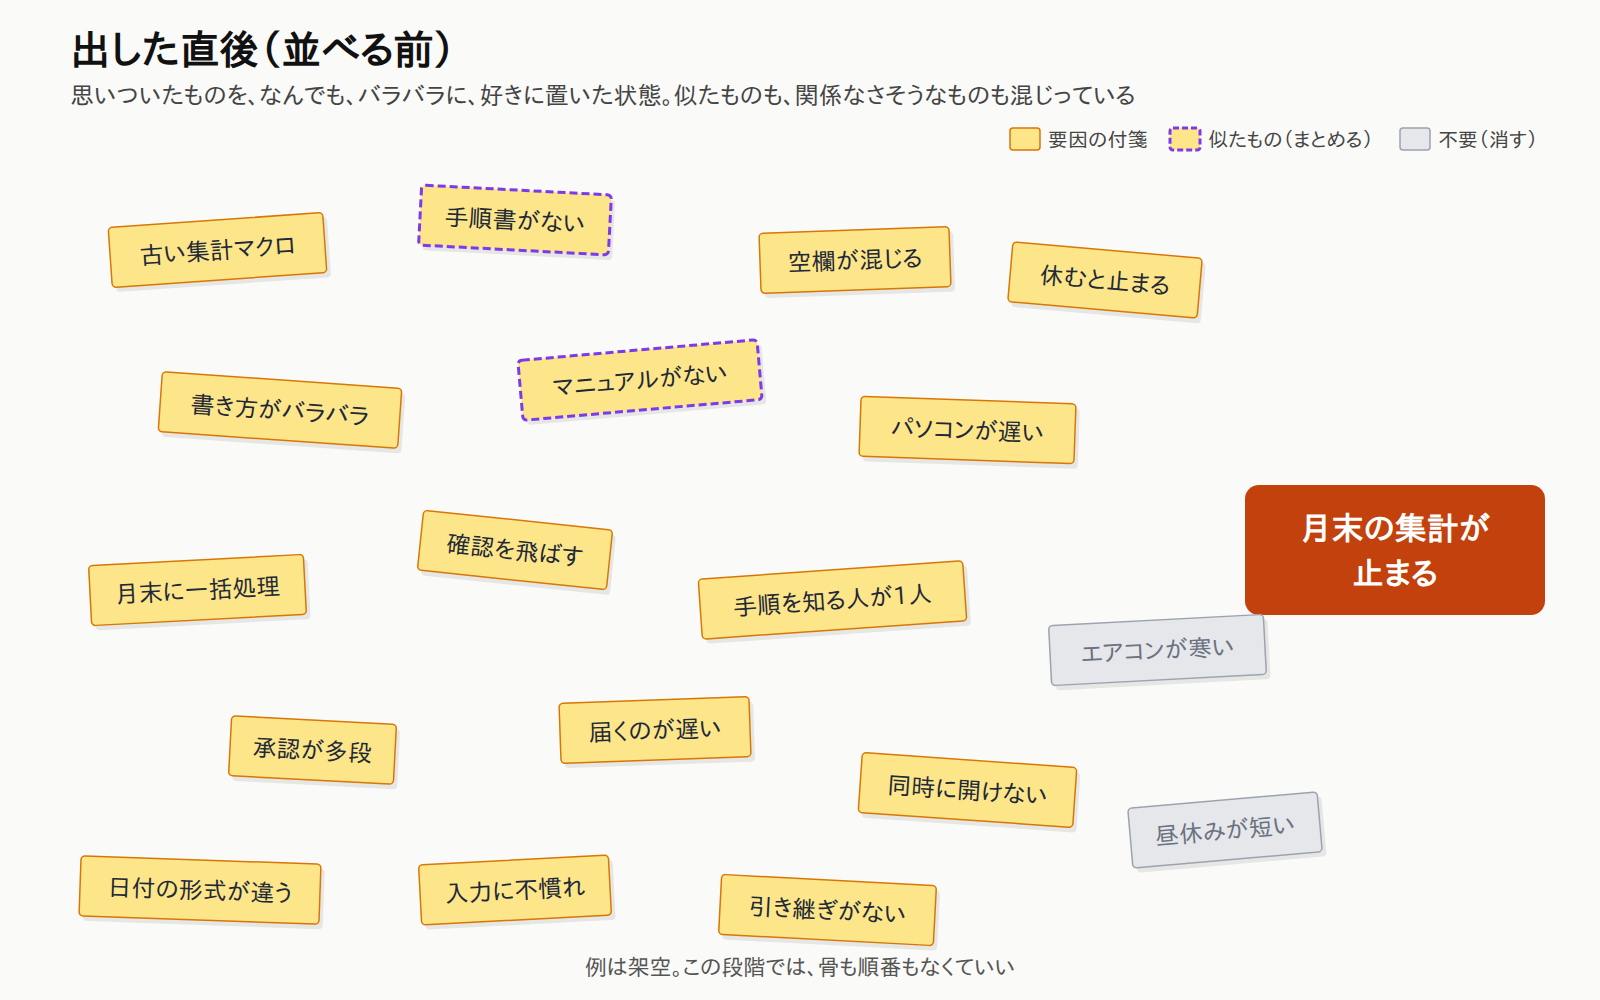
- Put out: Anything that comes to mind can go anywhere, scattered, however you like.
- Group: Everyone looks at all the causes, groups similar ones, and removes ones no longer needed.
- Arrange: Sort the grouped causes onto the big bones and arrange them in order, big → medium → small.
- Decide: Among the lined-up candidates, narrow down which one matters by discussion, then confirm with data (Lining them up does not settle the cause).
Right after putting them out, it’s fine if it looks messy like this. Similar ones and unrelated-looking ones are mixed in.
Group similar ones, remove the unneeded ones, and rearrange big → medium → small, and you get this.
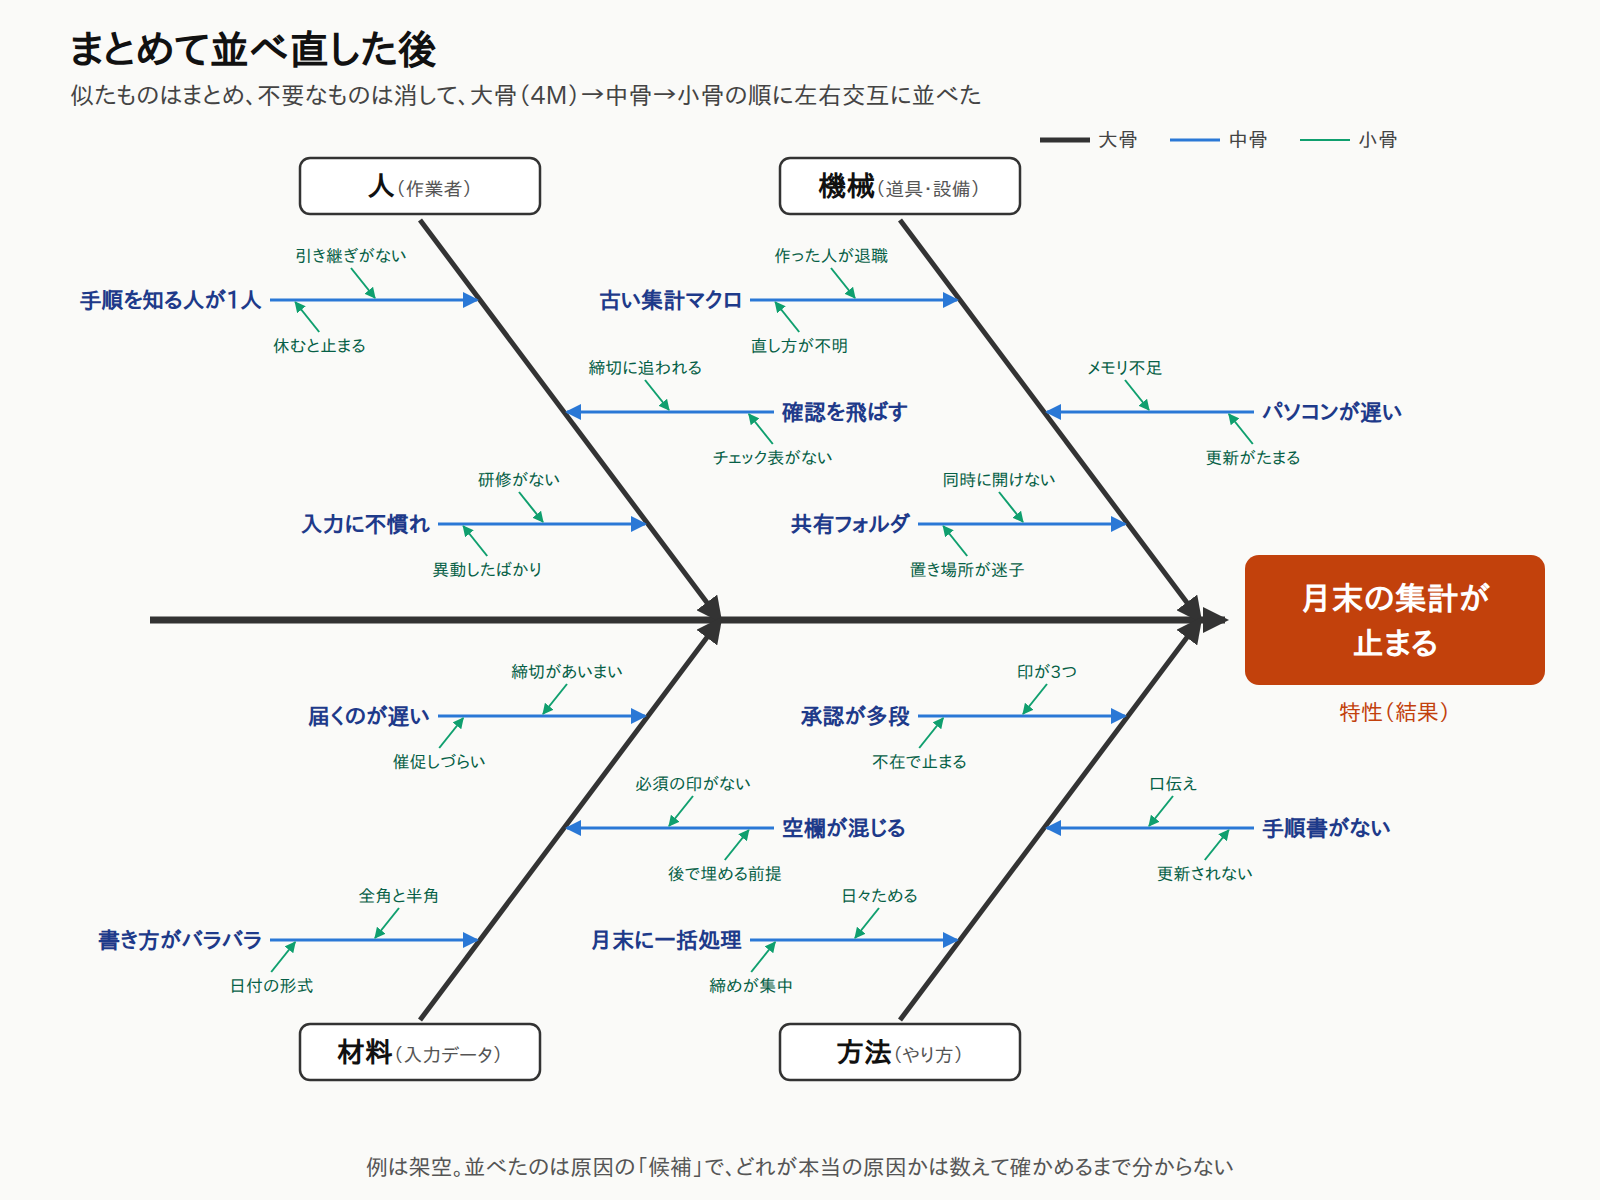
There is a standard set of big bones: 4M (Man, Machine, Material, Method).
Sort the grouped causes onto the 4M big bones, and for each, keep asking “why?” to line them up into medium bones and small bones.
About four to six big bones is just right (Satoshi Ebata, “Key Points for Using the Seven QC Tools, Part 5: The Cause-and-Effect Diagram” (JUSE), in Japanese).
Don’t prune at first
This happened when I was making a cause-and-effect diagram with everyone in a QC activity. One person started pruning the small bones others had added, on their own, and tidying up.
The ideas that were about to come out stopped right there. Later, alone, I put that frustration into a cause-and-effect diagram of its own. The big-hearted diagram took in even my bad mood.
When everyone is putting out bones, the four rules of brainstorming help (Satoshi Ebata, “Key Points for Using the Seven QC Tools, Part 5: The Cause-and-Effect Diagram” (JUSE), in Japanese).
- No criticism: Don’t shoot down other people’s ideas
- Freewheeling: Take up any idea at all
- Quantity: The more, the better
- Piggyback: Build on other people’s ideas to come up with more
Tidy up only after everything is out. Check for gaps, make sure no “why?” points the wrong way, and mark the causes that look most influential. Don’t skip this order and tidy from the start.
Lining them up does not settle the cause
Because it is so big-hearted, the cause-and-effect diagram takes in anything.
But it won’t tell you which of the things it took in is the real cause.
What the diagram lines up are “candidates” for the cause. Which one matters is narrowed down by discussion and decided by confirming with data (Satoshi Ebata, “Key Points for Using the Seven QC Tools, Part 5: The Cause-and-Effect Diagram” (JUSE), in Japanese).
Takeaways
We’re quick to tidy up, quick to declare the main cause.
But the cause-and-effect diagram doesn’t smile on the impatient.
For now, hang in there until it’s all done.
Narrow it down to the cause that, no matter how many times you think it over, is the one.
If you’re doing it alone, it’s fine to take days.
Trivia
- Kaoru Ishikawa: A quality control researcher (1915–1989) and professor at the University of Tokyo. He gave birth to QC circles and is called “the father of QC circles” (Kaoru Ishikawa centennial (JUSE), in Japanese).
- “Miserarete” (Enchanted): Judy Ongg’s 1979 song, which won that year’s Japan Record Award (Daily Sports, December 27, 2018, in Japanese). Even now, she sings it in a white costume whose sleeves spread wide when she opens her arms (Shukan Josei PRIME, in Japanese).
History
The start
The cause-and-effect diagram was devised by Kaoru Ishikawa, who studied quality control at the University of Tokyo. It is said to have first been used in 1953 at Kawasaki Steel’s Fukiai Works (Chronology: Professor Ishikawa, who walked alongside Japan’s TQC (JUSE), in Japanese).
The year before, in 1952, Ishikawa had received the Deming Prize, an award in the field of quality control (same chronology).
Becoming a tool of the workplace
In 1962, QC circles were born: small groups of workplace members who improve quality on their own (JUSE, “QC Circle” magazine, in Japanese). Easy to make and drawable anywhere with paper and a pen, the cause-and-effect diagram came into wide use as a tool for workplace discussions.
Today
Quality control courses still teach how to set up big bones with 4M or 5M1E and add small bones by asking “why?” (Satoshi Ebata, “Key Points for Using the Seven QC Tools, Part 5: The Cause-and-Effect Diagram” (JUSE), in Japanese).
Timeline
| Period | Key events | Key people and organizations | Country or region | Notes |
|---|---|---|---|---|
| 1915 | Kaoru Ishikawa is born | Kaoru Ishikawa | Japan | Born in Tokyo. He later studied quality control at the University of Tokyo and became one of the leaders of Japanese quality control. [Chronology: Professor Ishikawa (JUSE), in Japanese](https://www.juse.jp/ishikawa/ningen/Chronology_20150519.pdf) |
| 1947 | Kaoru Ishikawa becomes an associate professor at the University of Tokyo | Kaoru Ishikawa | Japan | From the following year, 1948, he begins studying statistical methods with graduate students and others. [Chronology: Professor Ishikawa (JUSE), in Japanese](https://www.juse.jp/ishikawa/ningen/Chronology_20150519.pdf) |
| 1952 | Kaoru Ishikawa receives the Deming Prize | Kaoru Ishikawa | Japan | An award in the field of quality control. The same year he also served as a temporary member of the Japanese Industrial Standards Committee under MITI. [Chronology: Professor Ishikawa (JUSE), in Japanese](https://www.juse.jp/ishikawa/ningen/Chronology_20150519.pdf) |
| 1953 | Kaoru Ishikawa devises the cause-and-effect diagram | Kaoru Ishikawa | Japan | Used at Kawasaki Steel’s Fukiai Works. It writes out the relationship between a result and candidate causes in the shape of a fish skeleton. [Chronology: Professor Ishikawa (JUSE), in Japanese](https://www.juse.jp/ishikawa/ningen/Chronology_20150519.pdf) |
| 1962 | QC circles are born | JUSE (Union of Japanese Scientists and Engineers) | Japan | Small groups of workplace members who improve quality on their own. The cause-and-effect diagram became a tool for their discussions. [JUSE, “QC Circle” magazine, in Japanese](https://www.juse.or.jp/qc_circle/about/) |
| Today | Setting up bones with 4M and 5M1E is taught | JUSE | Japan | Write the characteristic as a “bad result,” set up big bones with 4M or 5M1E, and add small bones by asking “why?” Narrow down the causes by confirming with data. [Satoshi Ebata, “Key Points for Using the Seven QC Tools, Part 5,” in Japanese](https://www.juse.or.jp/upload/files/shanai_rensai_Q7_05.pdf) |